Shear and Moment Diagrams
As an alternative to splitting a body in half and performing an equilibrium analysis to find the internal forces and moments, we can also use graphical approaches to plot out these internal forces and moments over the length of the body. Where equilibrium analysis is the most straightforward approach to finding the internal forces and moments at one cross section, the graphical approaches are the most straightforward approaches to find the internal forces or the internal moments across the entire length of a beam, shaft, or other body. This may be useful in complex loading scenarios where it may not be obvious where the maximum internal forces or internal moments exist. As a trade off however, we will need to plot out each type of internal load separately (one plot for internal axial forces, one for internal shear forces, one for internal torques, and one for internal bending moments).
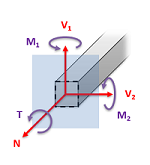
In this section, we will be focusing on the methods used to generate the plots for the internal shearing forces, and the internal bending moments. This will be the force and moment acting in the plane of the cross section. In cases where we have a horizontal beam and primarily vertical forces (such as in the diagram above), we will specifically be looking at vertical shearing forces (V1) and bending moments about a horizontal axis (M2), and the shear and moment diagrams will plot these elements respectively. We will group these plots together, because they will often be used together and because we will need to create the shear diagram in order to create the moment diagram.
Creating the Shear Diagram
The shear diagram will plot out the internal shearing forces within a beam, or other body that is supporting multiple forces perpendicular to the length of the beam or body itself. The shear and moment diagrams are both used primarily in the analysis of horizontal beams in structures, such as floor joists, ceiling joists, and other horizontal beams used in construction.

To create the shear force diagram, we will use the following process.
- Solve for all external forces acting on the body.
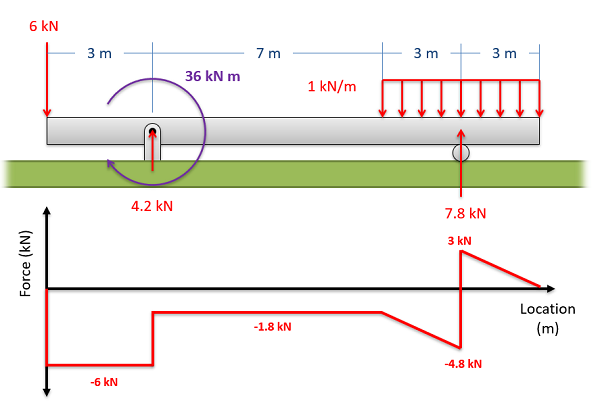
- Draw out a free body diagram of the body horizontally. Leave all distributed forces as distributed forces and do not replace them with the equivalent point load.
- Lined up below the free body diagram, draw a set of axes. The x-axis will represent the location (lined up with the free body diagram above), and the y-axis will represent the internal shear force.
- Starting at zero at the left side of the plot, you will move to the right, pay attention to forces in the free body diagram above. As you move right in your plot, keep steady except...
- Jump upwards by the magnitude of the force for any point forces going up.
- Jump downwards by the magnitude of the force for any point forces going down.
- For any uniform distributed forces you will have a linear slope where the magnitude of the distributed force is the slope of the line (positive slopes for upwards distributed forces, negative slopes for downwards distributed forces).
- For non-uniform distributed forces, the shape of the shear diagram plot will be the integral of the force function.
- You can ignore any moments or horizontal forces applied to the body.
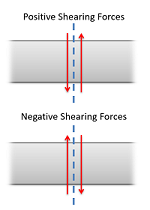
To read the plot, you simply need to find the location of interest from the free body diagram above, and read the corresponding value on the y-axis from your plot. Positive numbers represent an upwards internal shearing force to the right of the cross section and a downwards force on the left, and negative numbers indicate a downwards internal shearing force to the right of the cross section and a upwards force on the left. A visual of these forces can be seen in the diagram to the right.
Creating the Moment Diagram
The moment diagram will plot out the internal bending moment within a horizontal beam that is subjected to multiple forces and moments perpendicular to the length of the beam. For practical purposes, this diagram is often used in the same circumstances as the shear diagram, and generally both diagrams will be created for analysis in these scenarios.
To create the moment diagram for a shaft, we will use the following process.
- Solve for all external forces and moments, create a free body diagram, and create the shear diagram.
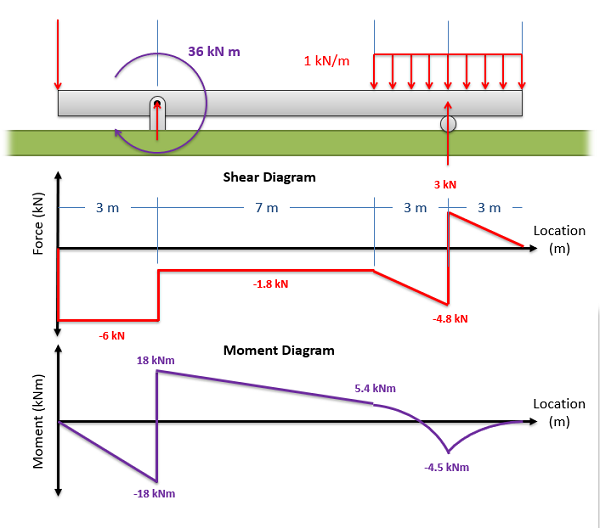
- Lined up below the shear diagram, draw a set of axes. The x-axis will represent the location (lined up with the shear diagram and free body diagram above), and the y-axis will represent the internal bending moment.
- Starting at zero at the left side of the plot, you will move to the right, pay attention to shear diagram and the moments in the free body diagram above. As you move right in your plot, the moment diagram will primarily be the integral of the shear diagram, except...
- Jump upwards by the magnitude of the moment for any negative (clockwise) moments.
- Jump downwards by the magnitude of the moment for any positive (counter-clockwise) moments.
- You can ignore any forces in the free body diagram.
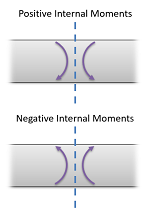
To read the plot, you simply need to find the location of interest from the free body diagram above, and read the corresponding value on the y-axis from your plot. Positive internal moments would cause the beam to bow downwards (think a smile shape) negative internal moments will cause the beam to bow upwards (think a frown shape). You can also see the positive and negative internal moments in the figure to the right.