Axial Force Diagrams and Torque Diagrams
As an alternative to splitting a body in half and performing an equilibrium analysis to find the internal forces and moments, we can also use graphical approaches to plot out these internal forces and moments over the length of the body. Where equilibrium analysis is the most straightforward approach to finding the internal forces and moments at one cross section, the graphical approaches are the most straightforward approaches to find the internal forces or the internal moments across the entire length of a beam, shaft, or other body. This may be useful in complex loading scenarios where it may not be obvious where the maximum internal forces or internal moments exist. As a trade off however, we will need to plot out each type of internal load separately (one plot for internal axial forces, one for internal shear forces, one for internal torques, and one for internal bending moments).
In this section, we will be focusing on the methods used to generate the plots for the internal axial forces, and the internal torques. This will be the force and moment acting along the length of the beam or shaft. The axial force plot is used primarily for vertical columns or cables supporting multiple loads along its length. The torque diagram is used primarily for shafts supporting multiple inputs and outputs. Each of these plots will have a different practical application, but we have grouped them together here because the process used to generate each of the two plots is very similar.
Creating the Axial Force Diagram
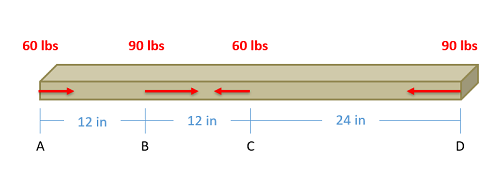
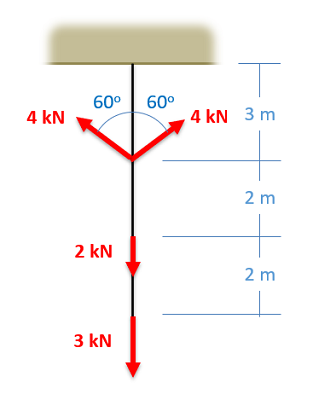
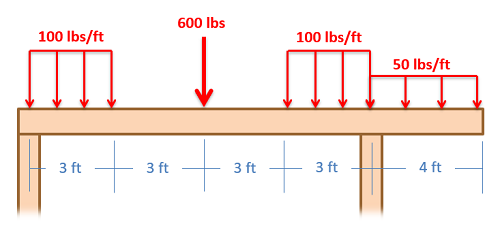
The axial force diagram will plot out the internal axial (normal) forces within a beam, column, or cable that is supporting multiple forces along the length of the beam itself. This can be thought of as the internal tension or compression forces. The most relevant practical scenarios that match this description will be main support columns in a multi-story building, or hanging cables that are used to support multiple loads.

To create the axial force plot for a body, we will use the following process.
- Solve for all external forces acting on the body.
- Draw out a free body diagram of the body horizontally. In the case of vertical structures, rotate the body so that it sits horizontally and all the forces act horizontally
- Lined up below the free body diagram, draw a set of axes. The x-axis will represent the location (lined up with the free body diagram above), and the y-axis will represent the internal axial forces, with positive numbers indicating tension and negative numbers indicating compression.
- Starting at zero at the left side of the plot, you will move to the right, pay attention to forces in the free body diagram above. As you move right in your plot, keep steady except...
- Jump upwards by the magnitude of the force for any forces in our free body diagram to the left.
- Jump downwards by the magnitude of the force for any forces to the right.
- You can ignore any moments or vertical forces applied to the body.
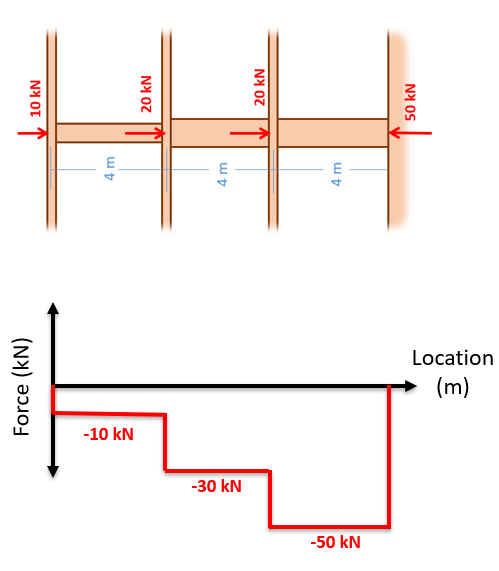
To read the plot, you simply need to find the location of interest from the free body diagram above, and read the corresponding value on the y-axis from your plot. Again, positive numbers represent an internal tension at that location and negative numbers represent an internal compression at that location.
Creating the Torque Diagram
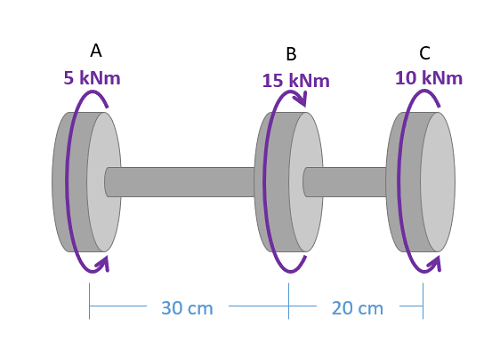
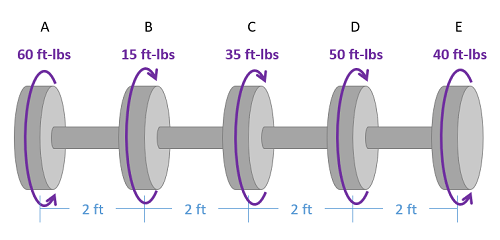
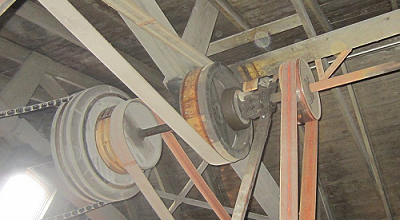
The torque diagram will plot out the internal torsional moment within a shaft that is supporting multiple inputs and/or outputs along its length. The most relevant practical scenarios that match this description are shafts within complex gear or pulley driven systems.
To create the torque diagram for a shaft, we will use the following process.
- Solve for all external moments acting on the shaft.
- Draw out a free body diagram of the shaft horizontally, rotating the shaft if necessary, so that all torques act around the horizontal axis.
- Lined up below the free body diagram, draw a set of axes. The x-axis will represent the location (lined up with the free body diagram above), and the y-axis will represent the internal torsional moment, with positive numbers indicating an internal torsional moment vector to the right and negative numbers indicating an internal torsional moment to the left.
- Starting at zero at the left side of the plot, you will move to the right, pay attention to moments in the free body diagram above. As you move right in your plot, keep steady except...
- Jump upwards by the magnitude of the moment for any torques in our free body diagram where the moment vector would point left.
- Jump downwards by the magnitude of the moment for any torques in our free body diagram where the moment vector would point right.
- You can ignore any forces in the free body diagram or moments not about the x axis.
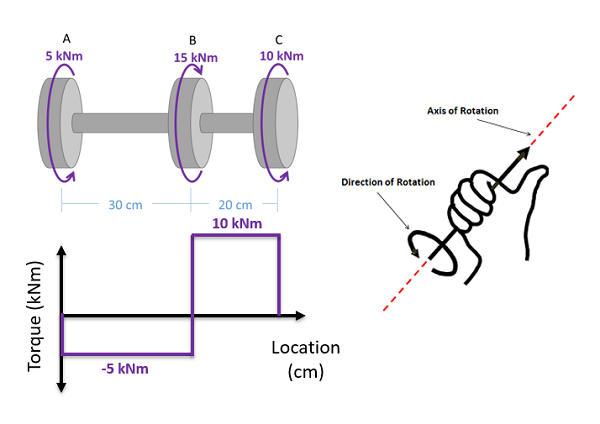
To read the plot, you simply need to take the find the location of interest from the free body diagram above, and read the corresponding value on the y-axis from your plot.